Text
The Speaking Dashboard
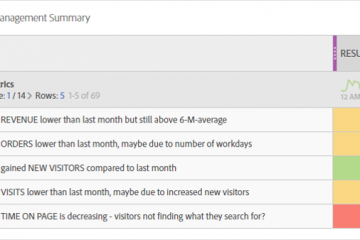
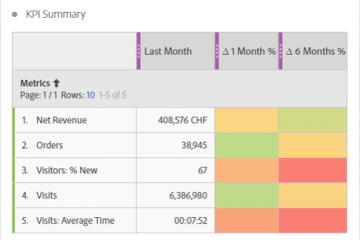
In Adobe Analytics Workspace you can create dynamic text which describes what happened. It is a table with custom text dynamically explaining your KPI. Don’t believe me? I will show you how you can create your own “Speaking Dashboard”! And I promise, it is very easy to create! Basically the Read more…

