Let’s introduce the 2-20-200 principal to you. I first read about it from Marco Hassler in his book «Web Analytics». It tells you to build dashboards in a way that you can see the overall situation in 2 sec, Identify the problematic areas in 20s and Recognize the precise reasons in around 200s.
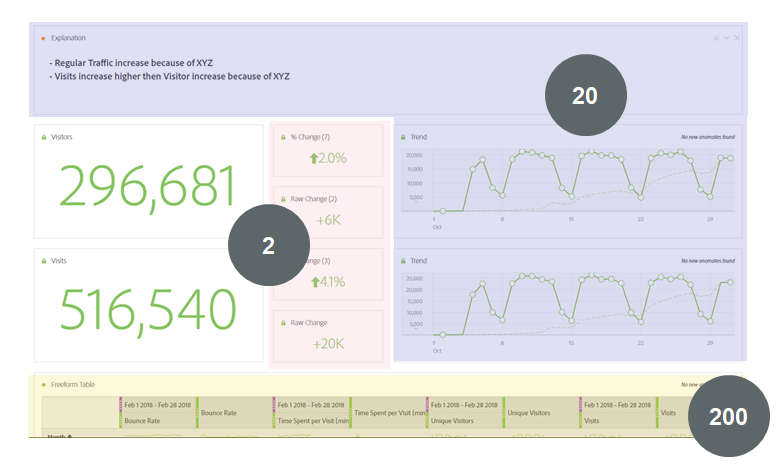
The screenshot above is an example with the applied principal. In the light red area the overall situation is displayed. In the light purple area problems could be identified and in the light yello area in the precise reasons could be investigated.
But which visualization you choose is again depending on your stakeholders needs.
0 Comments