Empathy at one hand means to read between the lines, at the other hand it also means to reflect an understanding in the dashboards, in using their words and language to name metrics, dimensions and describe data.
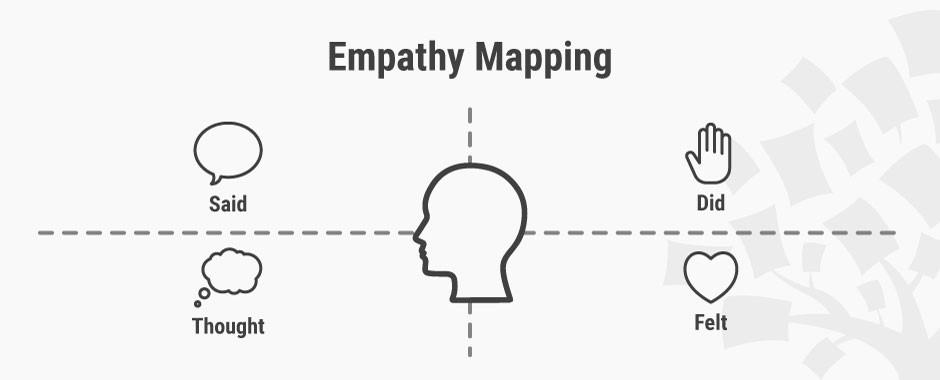
Let’s explain the empathy map to you. The empathy map was created as a tool to help you gain understanding for a targeted persona. You need to put yourself in the shoes of the person you are working with and come up with interpretations about how they feel, what they see, what they hear, what they say and does when they are dealing with the dashboard you are offering. We always think our dashboards are perfect and intelligible, but often we are far away from what the stakeholder need.
We are used to talk in the same way as we have the data, e.g. bounce rate, conversion rate, exit rate. But is this the language the business understands? Why don’t we use words (and variables) in the dashboard, the business intentionally knows what we are talking about? As example use Net Revenue instead of Revenue or Social Channel instead of Custom Conversion 10.
0 Comments