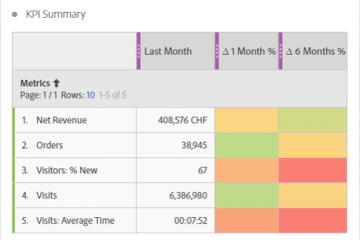
One of the big challenges an analyst faces during the work is the overwhelming amount of data each analytics tool collects from the visitors. Even a simple implementation and some traffic on the page can already lead to quite a variety of different data points. And when the analysts starts to create the first report, there will be one big question: what data should be on the report?
Since a (perfect) dashboard should always help business to take the right actions, it is a good bet to start talking with them, based on what you figured out while talking to people. what are the main key performance indicators (KPI) of the website? what might drive the success or failure of those KPI?
but always remember, that you have too much data for one dashboard. or that you might have no data for some business requirements – either there is no tracking or it is simply not measurable.
not everything that can be counted counts.
not everything that counts can be counted
(William Bruce Cameron)
Take those sentences as an advice when talking with business about the content of a dashboard. always keep focused on the main KPI! maybe you need some good words until the business agrees to skip some data – but it’s worth doing it. not reporting some data does not mean it disappears! it is still available and can be accessed in case it is really needed.
On the other hand there might be situation where business asks for information where no data is available. if you’re lucky this can be solved by an update of the tag management, but sometimes it is just not measurable. do not try to spend too much time in creating a fancy workaround. sometimes a simple “we can’t measure that” will help…

0 Comments