We as analysts do have our preferences, but do they fit to the business? Again talk to the stakeholders and ask them what suits them best.
We have so many ways to deliver data. Urs and I love to deliver in/out of Workspace. So many possibilities in there to calculate, break down, split up and visualize. But as Urs and Adam Greco had covered in their last Blog post about calculating metrics between panels, it is not always such easy to do this.
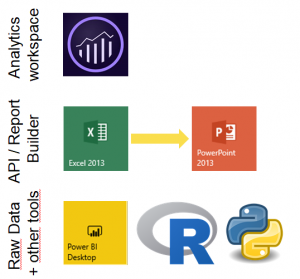
If you need more flexibility, using the API could be better. Using the Report Builder or a self build HTML/Javascript Dashboard gives much more flexibility in Design and functionality. It is also easiers to fill e.g. PowerPoint Slides with self updating charts.
On step ahead could be working with raw data to calculate own attribution models or using standard company software. Just focus on the one which fits best for the stakeholder.
0 Comments